The 100-year story of how a nation that feels poor got rich
A campaign poster of President William McKinley in the year 1900; Wikimedia Commons
You can learn a lot about somebody by looking through his receipts. Is he rich? Is she poor? Where does he shop? What does she value?
Alas, the U.S. economy doesn't come with a receipt. GDP tells us how much stuff we produce. GDI, or gross domestic income, tells us how much money we make. But these numbers don't tell us what the economy looks like from the viewpoint of a typical household.

Fortunately, we have something that's very close to an aggregate receipt for the American family going back more than a century: "100 Years of U.S. Consumer Spending", a report from the Bureau of Labor Statistics.
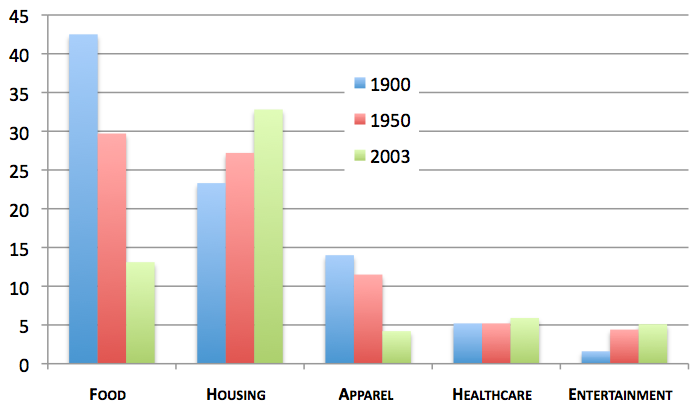
This is our story today: It is a story about how spending on food and clothing went from half the family budget in 1900 to less than a fifth in 2000.It is a story about how a nation that feels poor got so rich. Here's the big picture in one chart showing the share of family spending per category over the 20th century. The big story is that spending on food and clothes has fallen massively while spending on housing and services has gone up.
HOW WE SPEND: 1900
The year is 1900. The United States is a different country. We are near the end of the Millennium, but in the "warp and woof of life," we are living closer to the 1600s than the 2000s, as Brad DeLong memorably put it. A quarter of households have running water. Even fewer own the home they lived in. Fewer still have flush toilets. One-twelfth of households have gas or electric lights, one-twentieth have telephones, one-in-ninety own a car, and nobody owns a television.
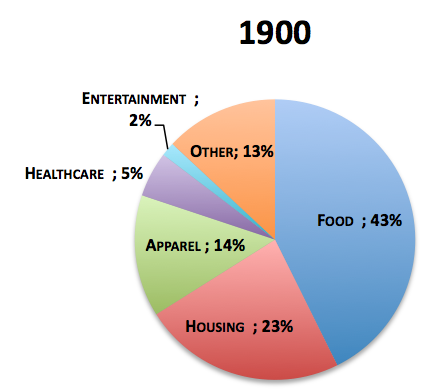
Families spend a whopping 80% of that on food, clothes, and homes.
In 1900, seen from perch of the Bureau of Labor Statistics -- which counts national jobs, income and spending -- the United States is like one big farm surrounded by a cluster of small factories. Almost half of the country works in agriculture. As for the budding services economy: There are more household servants than sales workers. As for the women's rights movement: More than twice as many households report income from children (22%) than wives (9%).
Over the next 100 years, the U.S. family got smaller, more reliant on
working women and computers, less reliant on working children and farms,
and, most importantly, much richer. About 68-times richer, in fact.
Household income (unadjusted for inflation) doubled six times in the 20th
century, or once every decade and a half, on average.
But to appreciate the transition in full, let's first meet it halfway.
HOW WE SPEND: 1950
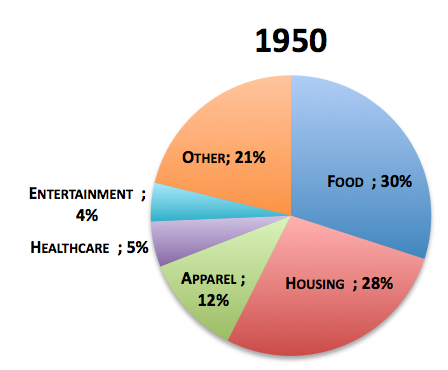
Meanwhile, the "making-stuff" economy is at its apex. Nearly half of working men are craftsmen or operators. (The female labor participation rate is still below 20%.) Factory wages have grown by seven-fold since 1901, and they've nearly tripled since the Great Depression. Textile manufacturing has never been higher and will never be higher. The year 1950 is its exact peak. Apparel manufacturing would grow through the 1970s before collapsing in the last third of the decade. The U.S. was the making-stuff capital of the world, and our dominance probably felt indefinite.
Half a century later, factories, just like farms before them, would become the victims of American efficiency.
HOW WE SPEND: 2003
It's become fashionable to consider the 1950s a golden age in American economics. Employment was full. Wages were rising. Manufacturing was strong. But if you're the kind of person who likes clothes or food, then welcome to paradise.
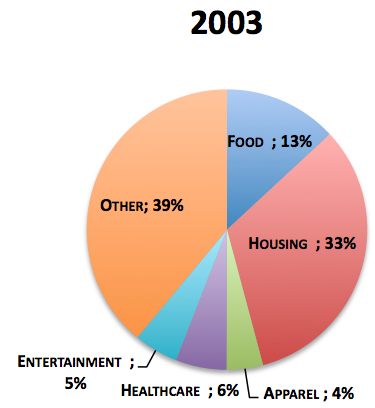 In the last 50 years, food and apparel's share of family has fallen from 42% to 17% (and remember, we were near 60% in 1900) as we've found cheaper ways to eat and clothe ourselves. Food production got more efficient, and we offshored the making of clothes to other countries with cheaper labor. As a result, apparel's share of the pie, which hardly changed in the first half of the century, shrank in the second half by two-thirds.
So if the typical American family feels squeezed, what's squeezing us?
I have two answers: The first answer is housing and cars. Half of that orange "other" slice is transportation costs: mostly cars, gas, and public transit. A century ago, if you recall, 80% of families were renters and nobody owned a car. Today, more than 60% of families are home owners, and practically everybody owns a car.*
The other answer, which you can't see as clearly in this chart, is health care. Health-care spending makes up more than 16% of the U.S. economy, but only 6% of family spending, according to the CES. One reason for the gap is that most medical spending isn't out of our pockets. Employers pay workers' premiums and government foots the bill for the elderly and the low-income. Government spending on Social Security, Medicare, and Medicaid has quadrupled since the 1950s in the most meaningful measurement, which is share of GDP.
In short, health care costs are squeezing Americans. But the details of this squeeze elude the color-wheel above. We are paying for health care with taxes, borrowing, and compensation that goes to health benefits, rather than wages.
THE 100-YEAR SQUEEZE
In 1900, the Bureau of Labor Statistics counted three categories as necessities: housing, food, and apparel. In the last 100 years, we've added to the list. Health care has become necessary. For most people, a car has become necessary. Even higher ed is a necessity for today's middle class.
We have new expectations for what our money should buy. We have earned (literally) the right to expect more from life in America.
Historical context shouldn't cheapen middle class suffering. Today's suffering is real. Unemployment is high. Wage growth is flat. We are squeezed by rising health care costs and scarcity of affordable housing in productive cities.
And yet, who can deny that we are richer? A century ago, we spent more than half our money on food and clothes. Today, we spend more than half of our money on housing and transportation. Our ambitions turned from bread and shirts to ownership and highways. We are all subtle victims of the expectations that 100 years of wealth have bought.
_____
*Even for people who decide not to buy, higher rent costs driven by popular coastal cities, constrictive urban policies, and a shortage of multifamily homes also increase housing costs
><
We want to hear what you think about this article. Submit a letter to the editor or write to letters@theatlantic.com.